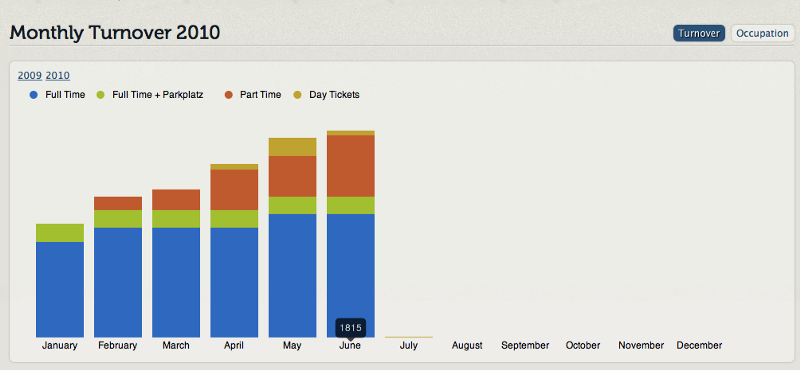
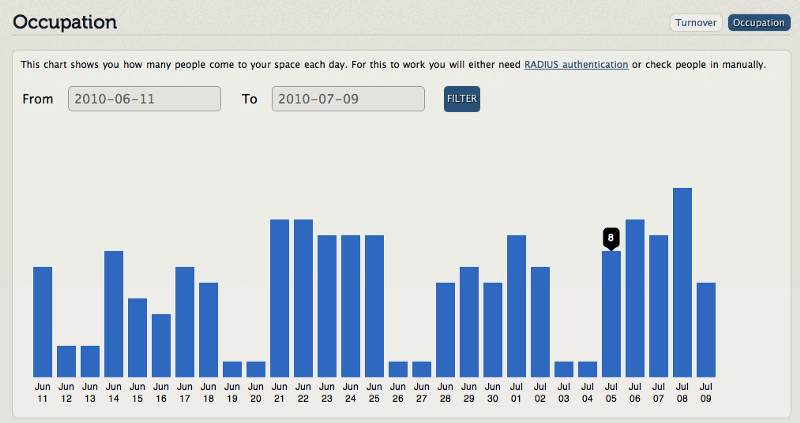
We just added new, interactive charts for the analytics sections. Not only are the charts easier to read than the old ones (esp. the turnover chart, which is now stacked, so you can see the overall turnover), they also look more beautiful and little bubbles pop up when you hover over them with the mouse, which is extremely sexy.
For the technically inclined: these charts use the gRaphaël JavaScript library, which in turn uses SVG, so there’s no Flash involved.